
Commodities underpin global value chains, and their production is exposed to human rights, environmental, economic and political risks that vary enormously by location. Aseri Commodity Intelligence provides a consistent, location-based view of those risks, at the source, across the commodities you finance or buy.
- Identify risks. Start with the commodity itself, where its production is most exposed to human rights, environmental, social and governance risk. Sourcing geography is layered on second, not averaged across a country.
- Analyse drivers. Compare risk across countries, regions and commodities using one consistent scoring methodology.
- Manage exposure. Use location-based risk insight to trigger proportionate due diligence, set assurance depth, inform sourcing decisions and evidence the whole thing.
From one number to a whole programme
Here is the part that gets missed. Commodity risk intelligence is not a report you read and file. It is the input that starts everything else moving — and once the first two stages are right, the rest of the cycle can be configured to your appetite rather than ours.
Aseri provides
You configure
The cycle operates in two lanes. What we build and maintain sits above the line; what you set sits below it. The inherent risk score is the handoff, and continuous monitoring feeds the loop back round.
Tailored, controlled approaches for the next steps
The value of a good inherent risk score is that it lets you stop treating every relationship the same way. That sounds obvious. In practice, most programmes still send the same questionnaire to everyone, audit by spend, and review on a fixed annual cycle regardless of what the risk actually is.
A controlled approach replaces that with something proportionate at every step.
Engagement is targeted, not blanket
Only the domains that clear your threshold trigger a questionnaire, and the questionnaire covers only those domains. A supplier receiving eight relevant questions about water discharge at its tanning operations responds very differently from one receiving eighty about everything. Response quality rises, response rates rise, and audit fatigue — which is largely self-inflicted — falls.
Questions follow an established logic
Our questionnaire structure follows the shape of the UN Guiding Principles and the OECD due diligence framework:
- Is the fundamental risk present?
- Is there certification?
- Is there a policy?
- Does it extend to the supply chain?
- Is due diligence conducted?
- Has anything been found?
- Is there remediation?
- Is there a grievance mechanism?
- Is effectiveness monitored?
- Is any of it publicly reported?
The questions are short, answerable, and designed so that a pattern of “no” is itself the finding.
Residual risk reflects what they actually do
Inherent exposure is moderated by the robustness of the counterparty’s evidenced control environment. A high inherent risk with a strong, demonstrated control environment lands materially lower than the same inherent risk with nothing behind it — and the difference is documented rather than assumed.
Assurance is proportionate and scheduled
Residual risk sets both the depth and the cadence: on-site verification for the highest positions, remote verification in the middle, and periodic self-attestation at the bottom, each on a defined review cycle.
This is where a “risk-based programme” stops being a phrase in a policy document and becomes a budget line you can defend.
Thresholds are yours, not ours
Institutions have different appetites, rating scales and regulatory obligations. Every threshold, band, domain weighting and escalation rule is configurable.
Some organisations trigger questionnaires at medium inherent risk. Others reserve engagement for high and above and use verification for the top band. The same underlying assessment supports both.
Built on a consistent scoring methodology
Comparability is the whole game. If a child labour finding in one commodity and a tailings failure in another cannot be placed on the same scale, you cannot prioritise across a portfolio. You can only prioritise within a category, which is not the same thing and is far less useful.
That comparability comes from grading everything against the same criteria. Aseri uses its proprietary Aseri Intelligence data scrape and public-issues salience analysis: an AI data-scraping tool combined with expert analysis of web searches across relevant ESG topics and public reports, with an option for continuous automated monitoring.
We assess millions of websites each day. The methodology is adapted from the UN Guiding Principles on Business and Human Rights and from established stakeholder salience theory, which holds that the significance of a claim rises with the cumulative number of attributes it possesses.
For each public report, we assess salience across three pillars:
- Materiality: the severity of an allegation.
- Substantiation: the weight of evidence behind it.
- Reach: its credibility and influence.
Reachinfluence & spread
Substantiationevidential weight
Materialityseverity of harm
Serious, well substantiated and carried by sources with standing. This is where the highest scores sit.
- Reach
- Substantiation
- Materiality
- Region 1, Reach only: Influential or widely carried, but with limited severity or proof.
- Region 2, Substantiation only: Well evidenced, but minor in severity and limited in influence.
- Region 3, Materiality only: A severe allegation with limited evidence and reach.
- Region 4, Reach + substantiation: Credible and influential evidence of a less severe issue.
- Region 5, Substantiation + materiality: Serious and well evidenced. Severity carries particular weight.
- Region 6, Reach + materiality: A serious issue carried by influential sources, with thinner proof.
- Region 7, All three attributes: Serious, well substantiated and carried by sources with standing. This is where the highest scores sit.
Salience rises as the attributes accumulate. Regions 1–3 carry one attribute only. Regions 4–6 carry two and take the most analyst judgement — where the issue is severe, severity leads. Region 7 carries all three: serious, well evidenced, and carried by sources with standing.
Each pillar is graded independently, then combined through our proprietary model. The weightings, thresholds and aggregation rules are not published, but the logic is. Every score drills down through the incidents that produced it to the individual reports behind each one.
Commodity-agnostic scoring makes your portfolio comparable
This is the quiet advantage, and it is worth dwelling on. Because the methodology is agnostic to the commodity — the same criteria, applied the same way, whether the subject is cobalt, cocoa or cotton — every pairing in your portfolio sits on one scale.
That means you can do things that are otherwise impossible:
- Rank your entire commodity exposure against a single issue.
- Rank a single commodity against every issue.
- Compare candidate sourcing geographies for the same input.
- See which of two structurally similar transactions carries materially different exposure.
- Aggregate across a whole book to find concentrations in commodity–origin pairs that share one regulatory vulnerability.
| Commodity | Environmental | Social | Governance | |||||||||||||||||
|---|---|---|---|---|---|---|---|---|---|---|---|---|---|---|---|---|---|---|---|---|
| Deforestation | Water stress and scarcity | Threat to biodiversity | GHG emissions | Degradation of aquatic resources | Degraded and fragmented landscapes | Child labour | Community health | Forced labour | Human rights | Community rights violations | Indigenous peoples’ rights | Security forces and human rights | Labour rights violations | Modern slavery | Poor occupational health and safety | Corruption | Informal production | Money laundering | Political instability | |
| Bauxite | ||||||||||||||||||||
| Cobalt | ||||||||||||||||||||
| Cocoa | ||||||||||||||||||||
| Coffee | ||||||||||||||||||||
| Copper | ||||||||||||||||||||
| Cotton | ||||||||||||||||||||
| Diamond | ||||||||||||||||||||
| Gold | ||||||||||||||||||||
| Graphite | ||||||||||||||||||||
| Iron ore | ||||||||||||||||||||
| Leather | ||||||||||||||||||||
| Lithium | ||||||||||||||||||||
| Mica | ||||||||||||||||||||
| Nickel | ||||||||||||||||||||
| Palm oil | ||||||||||||||||||||
| Rubber | ||||||||||||||||||||
| Sapphire | ||||||||||||||||||||
| Soya | ||||||||||||||||||||
| Tantalum | ||||||||||||||||||||
| Timber | ||||||||||||||||||||
| Tin | ||||||||||||||||||||
| Tungsten | ||||||||||||||||||||
Every commodity is assessed against every applicable risk category, banded from low to very high and grouped into environmental, social and governance families. The values shown here are illustrative and for demonstration only.
None of this works if each commodity is scored by its own bespoke method, or if the scale means something different in minerals than it does in agriculture. Consistency is not a nice-to-have. It is the precondition for portfolio-level analysis at all.
Geography second: location-based analytics and geospatial modelling
The commodity layer tells you what a good carries with it wherever it is produced. Geography is layered over the top, and this is where the modelling gets more interesting, because production is not evenly distributed within a country and neither is risk.
We combine location-based analytics with geospatial modelling to assess risk across global commodity production, using consistent scores supported by sub-national indicators wherever the data exists. Where a commodity is grown or extracted in specific regions, the assessment follows the production.
The geographic layer is built from authoritative international indices selected for each risk domain:
- Conflict intensity and rule of law.
- Governance and institutional capacity.
- Labour rights and freedom of association.
- Modern slavery prevalence and vulnerability.
- Child rights.
- Land and Indigenous tenure security.
- Occupational safety outcomes.
- Gender equality.
- Environmental performance across forest cover, biodiversity, pollution, emissions and resource degradation.
Sources are chosen against two criteria: recognised expertise in the relevant domain and methodological integrity.
Those indicators are normalised and, where necessary, inverted so they can be compared when aggregated while preserving the original spread within each.
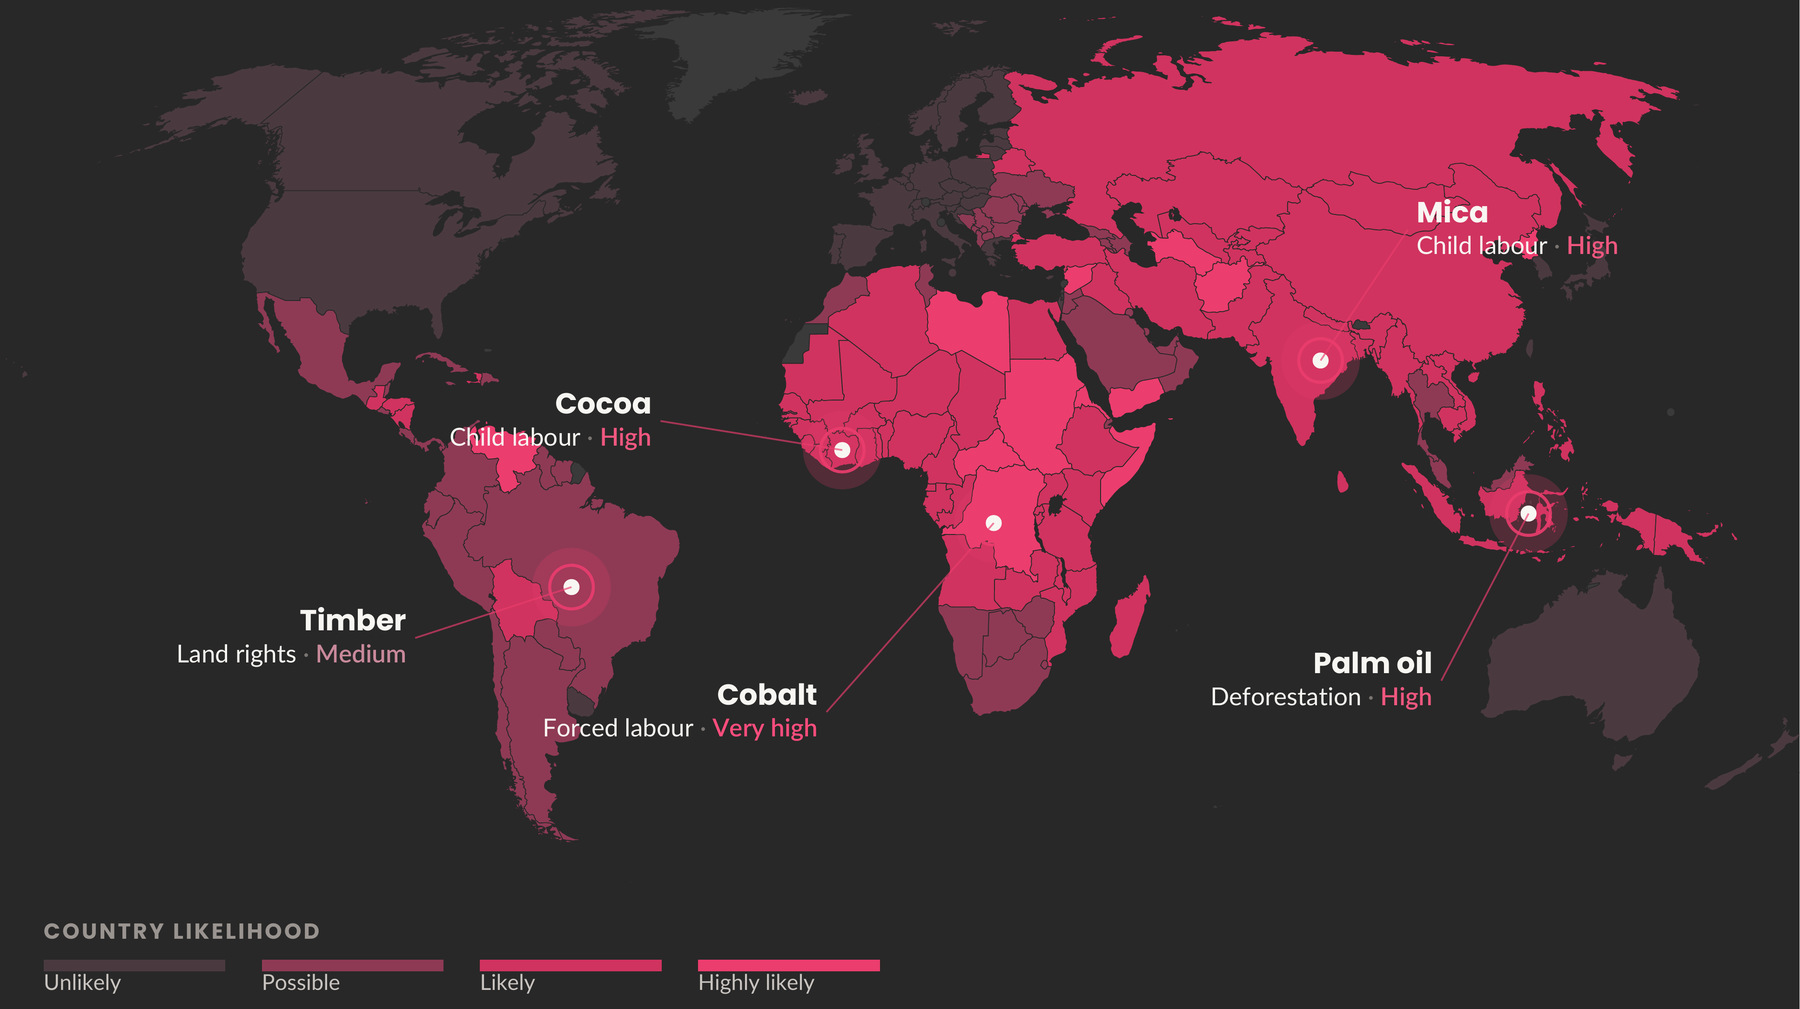
Two layers on one view: country likelihood as shading, commodity salience as markers at the point of production. Illustrative; bands and markers shown are for demonstration only.
- Timber: Land rights, Medium.
- Cocoa: Child labour, High.
- Cobalt: Forced labour, Very high.
- Mica: Child labour, High.
- Palm oil: Deforestation, High.
The map combines two layers in one view: country likelihood as shading and commodity salience as markers at the point of production. The bands and markers shown are illustrative and for demonstration only.
Layer the geography over the commodity score and you get inherent risk exposure — the assessment that drives everything downstream.
Who is it for?
Supply chain and procurement
Map sourcing exposure against location-based risk hotspots, identify the higher-risk production regions inside a category, and build sourcing strategies that account for risk before a contract is signed rather than after an incident.
Sustainability and due diligence
Assess environmental and social risk at the point of production, prioritise supplier engagement on a defensible basis, and evidence the assessment underneath a regulatory submission — not just the policy that produced it.
Risk and strategy
Bring commodity risk into enterprise risk frameworks, scenario analysis and long-term planning, with exposure resolved to the inputs that actually carry it rather than to a sector code.
Financial and investment decision-making
Assess how location-based commodity exposure affects assets, portfolios and transactions — from screening a single trade-finance instrument to heatmapping concentration across an entire book.
Commercial and market analysis
Understand how production risk may affect availability, pricing and market dynamics, and where disruption in one producing region propagates through to the inputs you depend on.
Assurance and advisory
Auditors, assurance providers, development finance institutions and advisory teams can use the same evidence base to scope their work and check somebody else’s.
What you actually get
Global commodity coverage
Coverage across major commodities and global production regions, using one consistent methodology throughout. Recycled and secondary streams are profiled separately from primary production.
Location-based production insight
Geospatially informed indicators supporting analysis across countries and sub-national regions wherever the underlying data supports it.
Multi-dimensional indicators
Environmental, social and governance coverage spanning deforestation, biodiversity, pollution and emissions; forced and child labour, labour rights, safety, land and Indigenous rights; corruption, illicit flows and informal production.
Comparable scoring
Standardised scoring that makes robust comparison possible across countries, regions and commodities — the precondition for portfolio-level prioritisation.
Integration and delivery
A platform application, structured digital exports, and APIs into your own onboarding, credit or procurement systems, resolvable against standard corporate identifiers and your own internal IDs.
Advisory on top
Threshold calibration, questionnaire design, matrix configuration and assurance strategy where the requirement is a designed programme rather than a data feed.
How it lands in your systems
Most organisations use more than one delivery route, because the analyst working case by case and the system screening at volume have different needs.
Analysts, credit officers and category managers work in the platform application, screening a commodity against an origin, comparing candidate geographies, drilling from a band down to the underlying reports, and exporting an assessment into a credit file or due diligence pack.
Systems consume the same scores through an API, resolvable against standard corporate identifiers and your own internal counterparty IDs, so a score arrives attached to the right record rather than requiring a manual match.
For bulk work — assessing an existing book or supply base in one pass, or refreshing a data warehouse on a schedule — structured digital exports do the job without anyone opening an interface.
Where the requirement is a designed programme rather than a data feed, our advisory team calibrates the thresholds, designs the questionnaire set, configures the matrices and helps set the assurance strategy. Most organisations start there and move to self-service once the configuration settles.
What we won’t claim
Our commodity scoring is built from the public record, and the public record is thinnest exactly where civic space is closed, journalists are at risk and courts do not function.
Absence of evidence is not evidence of absence. The geographic axis therefore draws on governance and rule-of-law indicators that rise as reporting capacity falls, and a quiet commodity signal in a closed environment does not collapse into a comfortable overall assessment.
These scores are prioritisation instruments, not verdicts. A high score means an issue is strongly associated with a commodity in a place. It does not mean the supplier in front of you is guilty of anything. The correct response to elevated inherent risk is to look harder, not to conclude.
Banding also involves judgement. Converting continuous scores and third-party indices into discrete levels means making calibration decisions against distributions that are anything but uniform.
We document those decisions and publish the continuous values underneath, so you can apply your own thresholds. But they are judgements, and we would rather say so than imply a precision the data does not support.
Used well, commodity risk intelligence is the first and widest filter in a funnel — the thing that turns four thousand relationships into forty that need real attention, with a written record of how you got from one number to the other.
Common questions.
Commodity risk intelligence assesses the human rights, environmental, social, governance, economic and political risks associated with a commodity and the places where it is produced. It provides a consistent basis for comparing exposure across commodities, countries and sub-national regions.
The commodity layer identifies risks associated with producing a particular good wherever it is produced. The geographic layer then accounts for where that production takes place, using country and sub-national indicators. Together they produce the inherent risk exposure.
Yes. Thresholds, bands, domain weightings and escalation rules can be configured to match your risk appetite, rating scale and regulatory obligations. The same underlying assessment can therefore support different engagement and assurance strategies.
No. The scores are prioritisation instruments, not verdicts. A high score means that an issue is strongly associated with a commodity in a particular place and should trigger proportionate investigation or due diligence.
Assessments can be used through the platform application, structured digital exports and APIs connected to onboarding, credit, procurement or data-warehouse systems. Advisory support is also available for threshold calibration, questionnaire design and assurance strategy.